Report
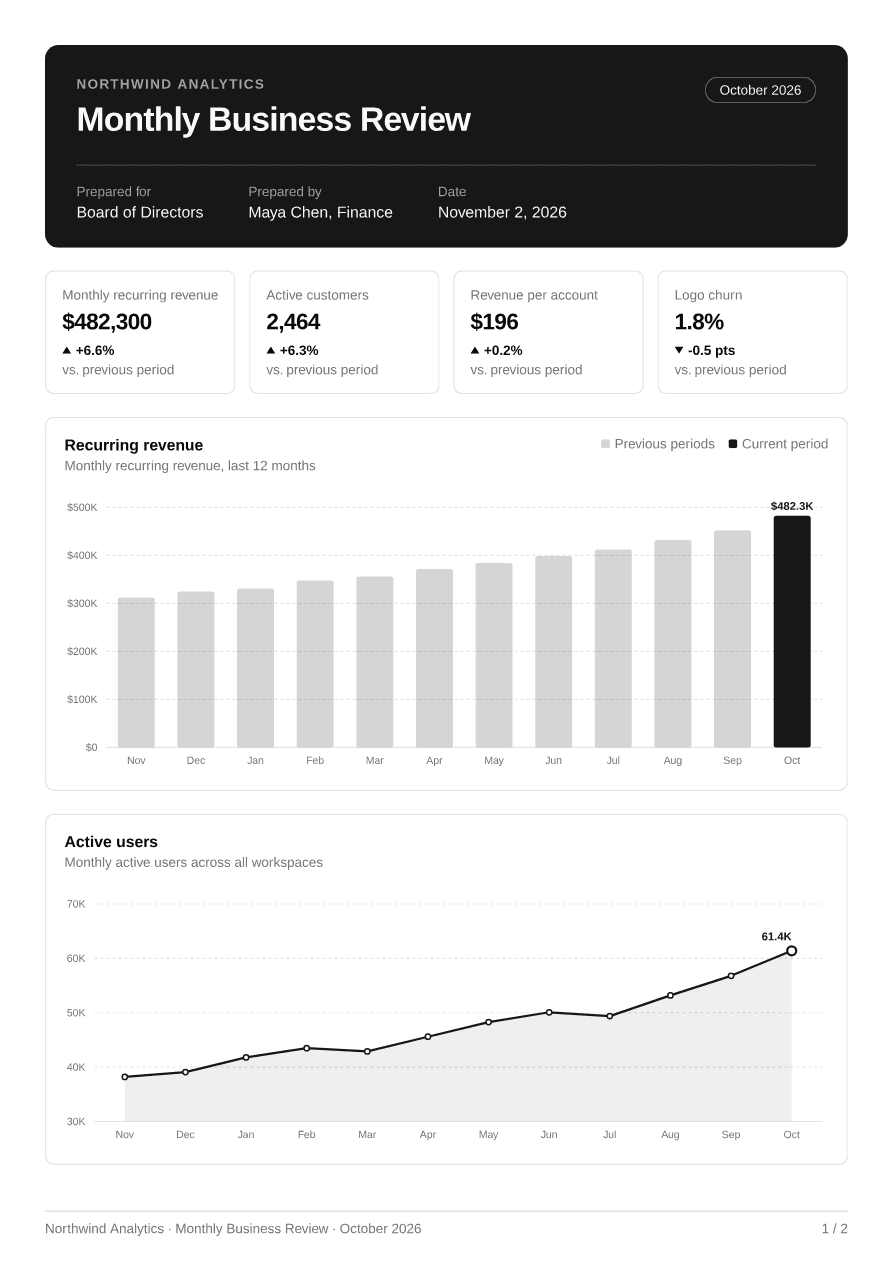
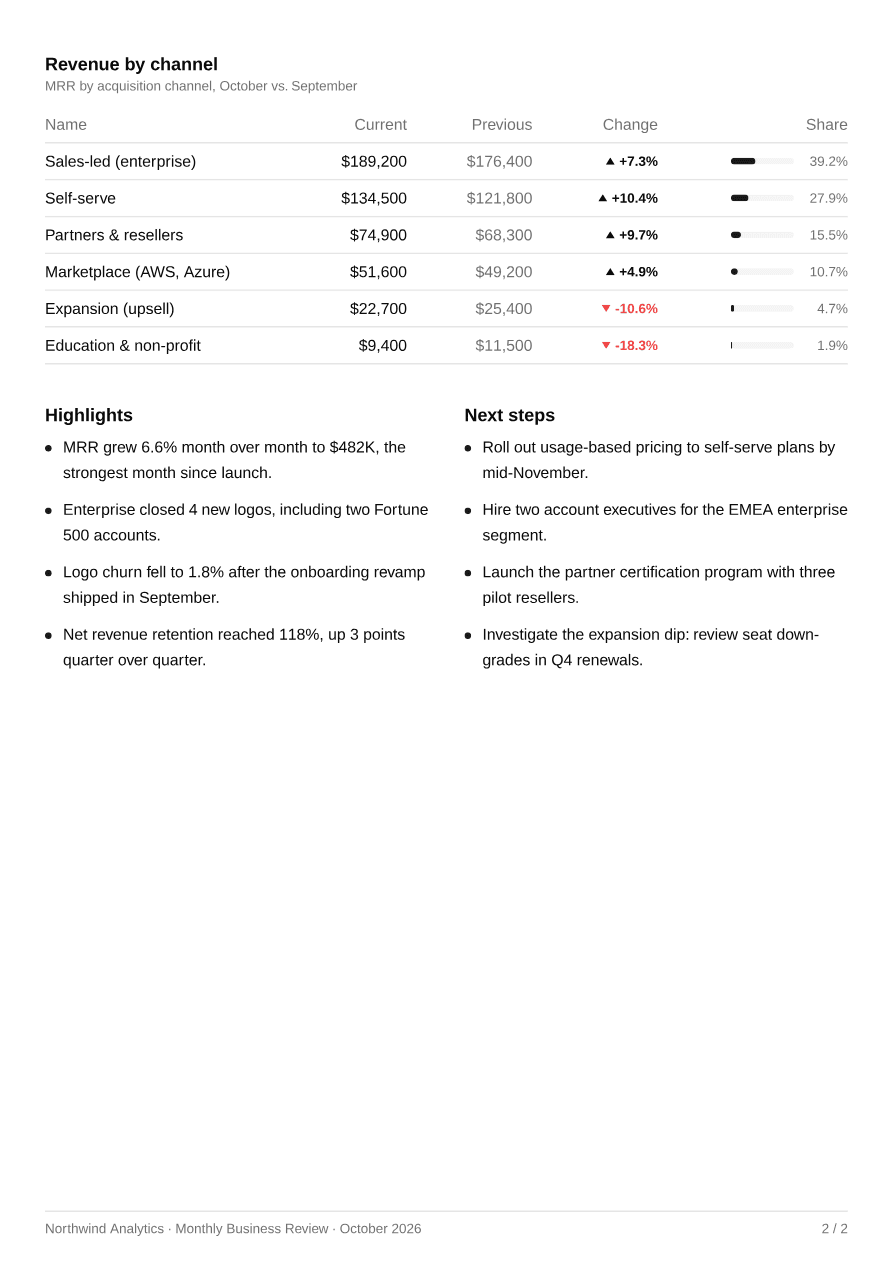
Monthly business report with a cover header, KPI cards, bar and line charts, a breakdown table and highlights.
import { Report } from "@/components/pdf/report";import { exampleReport } from "@/components/pdf/report-example";
export default function ReportExample() {  return <Report data={exampleReport} />;}
Installation
npx shadcn add https://ui-registry.com/r/pdf/report.jsonThis installs report.tsx, report-charts.tsx (the Svg charts), a report-example.ts with sample data, and the components it uses: Card, Heading, Page Footer and Table.
Usage
import { Report } from "@/components/pdf/report";
<Report data={{ company: "Northwind Analytics", title: "Monthly Business Review", period: "October 2026", date: new Date(2026, 10, 2), preparedFor: "Board of Directors", preparedBy: "Maya Chen, Finance", currency: "USD", locale: "en-US", kpis: [ { label: "MRR", format: "currency", value: 482_300, previous: 452_600 }, { label: "Logo churn", format: "percent", value: 0.018, previous: 0.023, lowerIsBetter: true }, ], barChart: { title: "Recurring revenue", format: "currency", points: [ { label: new Date(2026, 8, 1), value: 452_600 }, { label: new Date(2026, 9, 1), value: 482_300 }, ], }, lineChart: { title: "Active users", points: [ { label: "Sep", value: 56_800 }, { label: "Oct", value: 61_400 }, ], }, breakdown: { title: "Revenue by channel", rows: [{ label: "Self-serve", value: 134_500, previous: 121_800 }], }, highlights: ["MRR grew 6.6% month over month."], nextSteps: ["Roll out usage-based pricing."], }} theme={{ "--color-primary": "#0073e6" }}/>Report renders a full <Document>: pass it straight to PDFViewer, renderToBuffer, etc. Every section except the header is optional: omit barChart, lineChart, breakdown, highlights or nextSteps to leave it out.
Data shape
kpis: one card each (3–4 fit on a row).formatis"currency","number"or"percent"(percent values are fractions:0.018= 1.8%). Whenpreviousis set, the card shows the change with an up/down arrow: a relative change, or percentage points for percent metrics. SetlowerIsBetterfor metrics like churn or costs so a decrease is shown as good news.barChart/lineChart:title, optionaldescription,formatandpoints. A point label can be a string or aDate, formatted as a short month name indata.locale.breakdown: a table with the current value, previous value, change and share of the total (with an inline bar) for each row.highlights/nextSteps: bullet lists, shown side by side.
Charts
The charts in report-charts.tsx are plain Svg components you can reuse elsewhere: BarChart, LineChart and TrendArrow, plus niceScale(min, max, count) which rounds the axis to readable ticks (1, 2, 2.5 or 5 × 10ⁿ) from any data.
- The bar chart starts at zero and highlights the last bar as the current period.
- The line chart fits its axis to the data range to show the trend, with a soft area fill.
- Axis labels use compact notation (
$400K,40K) indata.locale. - Colors come from the theme (
primary,border,muted-foreground,background), so a customthemerecolors the charts too.
import { BarChart } from "@/components/pdf/report-charts";
<BarChart  formatValue={(v) => `${v}`}  height={160}  points={[{ label: "Q1", value: 120 }, { label: "Q2", value: 180 }]}  width={480}/>
Charts are sized in points: the block uses the A4 content width. If you change the page size or padding, adjust CHART_WIDTH in report.tsx.
Translate labels
All visible labels can be overridden:
<Report data={data} labels={{ change: "Évolution", currentPeriod: "Période en cours", date: "Date", highlights: "Faits marquants", name: "Nom", nextSteps: "Prochaines étapes", percentagePoints: "pts", preparedBy: "Préparé par", preparedFor: "Préparé pour", previous: "Précédent", previousPeriods: "Périodes précédentes", share: "Part", value: "Actuel", vsPrevious: "vs. période précédente", }}/>Amounts, numbers, percentages and dates are formatted with Intl using data.locale and data.currency.
Multi-page
The report flows onto as many pages as needed: KPI cards, charts and table rows are never split, the table header is repeated, and the footer (with page numbers) appears on every page. The example renders on two pages.